2. Boostrapping and permutation tests
2.1. Boostrapping
[1]:
import numpy as np
import pandas as pd
from scipy import stats
import scipy
from sklearn.linear_model import LogisticRegression
from sklearn.ensemble import ExtraTreesClassifier
from tqdm import tqdm
from multiprocessing import Pool
import matplotlib.pylab as plt
from sklearn.model_selection import train_test_split
import itertools
%matplotlib inline
[2]:
try:
    from torch import get_num_threads
    cpu_count = get_num_threads()
except ImportError:
    import os
    cpu_count = os.cpu_count()
[3]:
true_dist = stats.norm(.3, 1.3)
true_mean = true_dist.mean()
[4]:
# Get a 90% confidence interval for the mean using the central limit theorem

sample = true_dist.rvs(900)
mu_hat = sample.mean()
sigma_hat = sample.std() / np.sqrt(len(sample))
ci_interval_lower = stats.norm(mu_hat, sigma_hat).ppf(0.05)
ci_interval_upper = stats.norm(mu_hat, sigma_hat).ppf(0.95)
ci_interval_lower, ci_interval_upper
[4]:
(0.2994930692394472, 0.44398437591947654)
[5]:
# Get a 90% confidence interval for the mean using boostrap

sample = true_dist.rvs(900)
bootstrap_means = []
for _ in range(200):
    b_sample = np.random.choice(sample, len(sample))
    bootstrap_means.append(b_sample.mean())
bootstrap_means = np.sort(bootstrap_means)
ci_interval_lower = bootstrap_means[9]
ci_interval_upper = bootstrap_means[-10]
ci_interval_lower, ci_interval_upper
[5]:
(0.2612161649512032, 0.40027678090733715)
[6]:
# Check whether a 90% CI using CLT contains the true value 90% of the time (i.e. on 90% of experiments)

interval_contained_the_true_value = []
for _ in range(1000):
    sample = true_dist.rvs(900)

    mu_hat = sample.mean()
    sigma_hat = sample.std() / np.sqrt(len(sample))

    ci_interval_lower = stats.norm(mu_hat, sigma_hat).ppf(0.05)
    ci_interval_upper = stats.norm(mu_hat, sigma_hat).ppf(0.95)

    contained = ci_interval_lower <= true_mean and true_mean <= ci_interval_upper
    interval_contained_the_true_value.append(contained)

np.mean(interval_contained_the_true_value)
[6]:
0.904
[7]:
# Check whether a 90% CI using boostrap contains the true value 90% of the time (i.e. on 90% of experiments)

interval_contained_the_true_value = []
for _ in range(1000):
    sample = true_dist.rvs(900)

    bootstrap_means = []
    for _ in range(200):
        b_sample = np.random.choice(sample, len(sample))
        bootstrap_means.append(b_sample.mean())
    bootstrap_means = np.sort(bootstrap_means)

    ci_interval_lower = bootstrap_means[9]
    ci_interval_upper = bootstrap_means[-10]

    contained = ci_interval_lower <= true_mean and true_mean <= ci_interval_upper
    interval_contained_the_true_value.append(contained)

np.mean(interval_contained_the_true_value)
[7]:
0.892
2.1.1. Boostrapping on a logistic regression
[8]:
def data_generator():
    x = np.random.random((1000, 4))
    beta = stats.norm().rvs((4,1))
    beta[[0,-1]] = 0
    y = np.matmul(x, beta) + stats.norm().rvs((1000, 1))
    y = scipy.special.expit(y)
    y = np.random.random(y.shape) < y
    return x,y,beta
x,y,_ = data_generator()
[9]:
# Obtain bootstrap samples of the estimated coefficients

def bootstrap_coefs_samples_generator(x,y):
    bootstrap_coefs = []
    for _ in range(200):
        resampling_idx = np.random.choice(len(y), len(y))
        bts_y = y[resampling_idx]
        bts_x = x[resampling_idx]
        bts_est = LogisticRegression(solver='saga').fit(bts_x, bts_y.ravel())
        bootstrap_coefs.append(bts_est.coef_)
    return np.vstack(bootstrap_coefs)

bootstrap_coefs = bootstrap_coefs_samples_generator(x,y)
bootstrap_coefs.shape # (n_boostrap_sample, n_features)
[9]:
(200, 4)
[10]:
# Just as before, obtain bootstrap samples of the estimated coefficients
# but now using multiprocessing

def func(i):
    np.random.seed(i)
    resampling_idx = np.random.choice(len(y), len(y))
    bts_y = y[resampling_idx].copy()
    bts_x = x[resampling_idx].copy()
    bts_est = LogisticRegression(solver='saga').fit(bts_x, bts_y.ravel())
    return bts_est.coef_

def bootstrap_coefs_samples_generator(x,y):
    bootstrap_coefs = []

    bootstrap_coefs = Pool(cpu_count).map(func, range(200))
    return np.vstack(bootstrap_coefs)

bootstrap_coefs = bootstrap_coefs_samples_generator(x,y)
bootstrap_coefs.shape # (n_boostrap_sample, n_features)
[10]:
(200, 4)
[11]:
# Obtain CI 90% interval of the estimated coefficients using bootstrap

def obtain_ci_90(bootstrap_coefs):
    def extract_quantiles_5_and_95(x):
        p1 = 5*len(x)//100-1
        p2 = 95*len(x)//100
        return np.sort(x)[[p1,p2]]

    return np.apply_along_axis(extract_quantiles_5_and_95, 1, bootstrap_coefs.T)

obtain_ci_90(bootstrap_coefs)
[11]:
array([[-0.45130088,  0.19511093],
       [ 0.80341797,  1.54924732],
       [-0.83550332, -0.1421124 ],
       [-0.15388632,  0.56060763]])
[12]:
# Obtain the individual p-values of the coeficients (i.e.: testing H0: beta_i = 0)

def obtain_pvalues(bootstrap_coefs):
    def obtain_the_quantile_of_point(x, h0_point=0):
        pvalue1 = np.sum(np.sort(x)>=h0_point) / len(x)
        pvalue2 = np.sum(np.sort(x)<=h0_point) / len(x)
        return min(pvalue1, pvalue2) * 2

    return np.apply_along_axis(obtain_the_quantile_of_point, 1, bootstrap_coefs.T)

obtain_pvalues(bootstrap_coefs)
[12]:
array([0.58, 0. , 0.05, 0.26])
[13]:
# Checking wheather our 90% CI contains the true value 90% of the time (i.e. on 90% of experiments)

ci_contains_that_coef = []
for _ in tqdm(range(1000)):
    x, y, betas = data_generator()
    bootstrap_coefs = bootstrap_coefs_samples_generator(x,y)
    intervs = obtain_ci_90(bootstrap_coefs)
    is_contained = [(beta <= intervs[i,1] and beta >= intervs[i,0]).item() for i,beta in enumerate(betas)]
    ci_contains_that_coef.append(is_contained)

np.array(ci_contains_that_coef).mean(0)
100%|██████████| 1000/1000 [02:55<00:00, 5.70it/s]
[13]:
array([0.908, 0.763, 0.771, 0.892])
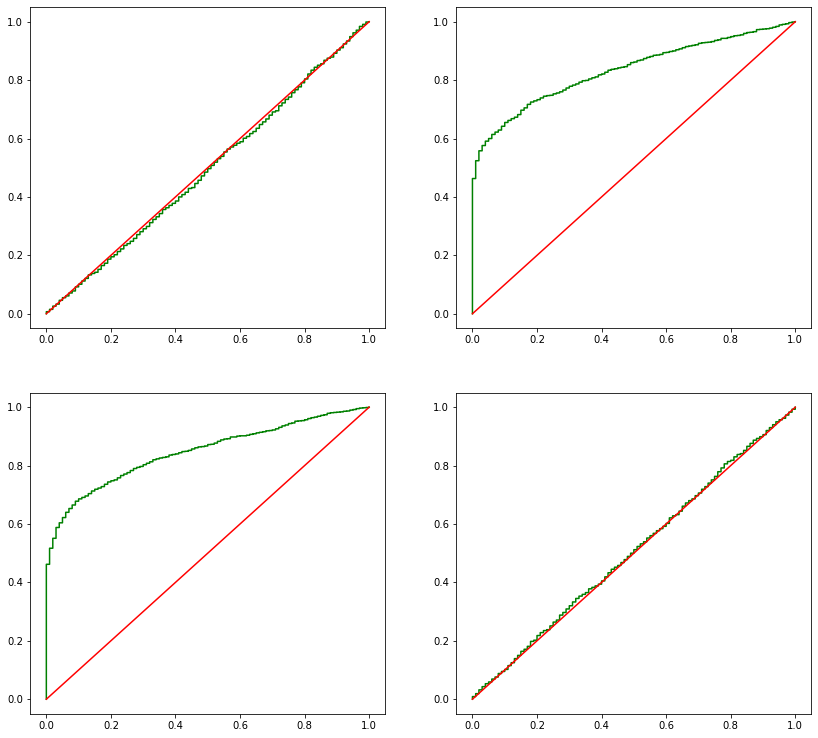
[14]:
# Obtaining the a sample of the distribution of our pvalues

pvalues = []
for _ in tqdm(range(1000)):
    x, y, betas = data_generator()
    bootstrap_coefs = bootstrap_coefs_samples_generator(x,y)
    pvalues.append(obtain_pvalues(bootstrap_coefs))

pvalues = np.vstack(pvalues)
100%|██████████| 1000/1000 [03:07<00:00, 5.33it/s]
[15]:
def ecdf_plot(x, ax, *args, **kwargs):
    xc = np.concatenate(([0], np.sort(x), [1]))
    y = np.linspace(0, 1, len(x) + 1)
    yc = np.concatenate(([0], y))
    ax.step(xc, yc, *args, **kwargs)

_, axes = plt.subplots(2, 2, figsize=(14,13))

for i, ax in enumerate(axes.flatten()):
    ecdf_plot(pvalues[:,i], ax, color='green')
    ax.plot(np.linspace(0,1), np.linspace(0,1), color='red')
2.2. Permutation tests
Here we check compare the performance of the estimator y given x with the performance y given x_permuted, with following procedure:
Split the dataset (y, x) into (y_train, x_train), (y_val, x_val)
Fit classifier to (y_train, x_train) and get its score on (y_val, x_val)
Store the score on score_unpermutted
For feature f in features:
For i in range(n_permutations):
Set x_train_p as x_train with feature f permutted, do the same for x_val
Fit classifier to (y_train, x_train_p) and get its score on (y_val, x_val_p)
Store the score on scores_permutted[i, f]
The pvalue for feature f is given by:
pvalue = score_unpermuted <= scores_permuted[:, f]
pvalue = (pvalue.sum() + 1) / (len(scores_permuted[:, f])+1)
See https://arxiv.org/pdf/1906.09735 for details
[16]:
def nl_data_generator(size=1000):
    x = np.random.random((size, 4))
    beta = stats.norm().rvs((4,1))
    beta[[0,-1]] = 0
    y = np.matmul(np.cos(x), beta) + stats.norm(0,.1).rvs((size, 1))
    y = y > y.mean()
    return x,y

x, y = nl_data_generator()
x_train, x_val, y_train, y_val = train_test_split(x, y, test_size=0.1)
del x, y
[17]:
def func(args):
    i, x_to_permute = args
    np.random.seed(i + x_to_permute*1000)

    # permute x_train for feature x_to_permute
    perm_idx = np.random.choice(len(x_train), len(x_train), False)
    x_train_p = x_train.copy()
    x_train_p[:, x_to_permute] = x_train_p[perm_idx, x_to_permute]

    bts_est = ExtraTreesClassifier()
    bts_est.fit(x_train_p, y_train.ravel())

    # permute x_val for feature x_to_permute
    perm_idx = np.random.choice(len(x_val), len(x_val), False)
    x_val_p = x_val.copy()
    x_val_p[:, x_to_permute] = x_val_p[perm_idx, x_to_permute]

    score = bts_est.score(x_val_p, y_val)
    return score

bts_est = ExtraTreesClassifier()
bts_est.fit(x_train, y_train.ravel())
score_unpermuted = bts_est.score(x_val, y_val)

def get_scores_of_permuted_features():
    scores_permuted = []
    for x_to_permute in range(x_train.shape[1]):
        score = Pool(cpu_count).map(func, itertools.product(range(99), [x_to_permute]))
        scores_permuted.append(score)
    return np.array(scores_permuted).T

scores_permuted = get_scores_of_permuted_features()
scores_permuted.shape # (n_boostrap_sample, n_features)
[17]:
(99, 4)
[18]:
def get_pvalues_from_scores(score_unpermuted, scores_permuted):
    pvalues = score_unpermuted <= scores_permuted
    pvalues = (pvalues.sum(0) + 1) / (len(scores_permuted)+1)
    return pvalues

get_pvalues_from_scores(score_unpermuted, scores_permuted)
[18]:
array([0.14, 0.01, 0.01, 0.2 ])
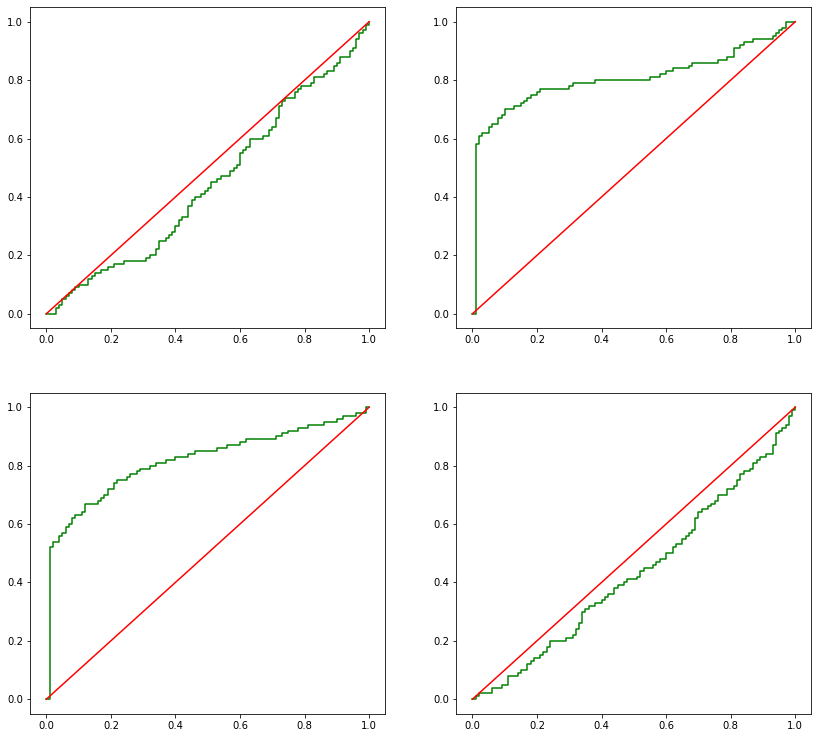
[19]:
# Checking the distribution of our pvalues

pvalues = []
for _ in tqdm(range(100)):
    x, y = nl_data_generator()
    x_train, x_val, y_train, y_val = train_test_split(x, y, test_size=0.1)
    del x, y

    bts_est = ExtraTreesClassifier()
    bts_est.fit(x_train, y_train.ravel())
    score_unpermuted = bts_est.score(x_val, y_val)

    scores_permuted = get_scores_of_permuted_features()
    pvalues_of_this_experiment = get_pvalues_from_scores(score_unpermuted, scores_permuted)

    pvalues.append(pvalues_of_this_experiment)

pvalues = np.vstack(pvalues)
100%|██████████| 100/100 [25:52<00:00, 15.52s/it]
[20]:
pvalues = np.vstack(pvalues)
[21]:
_, axes = plt.subplots(2, 2, figsize=(14,13))

for i, ax in enumerate(axes.flatten()):
    ecdf_plot(pvalues[:,i], ax, color='green')
    ax.plot(np.linspace(0,1), np.linspace(0,1), color='red')
[22]:
# Proportional of experiments where the pvalue is lower or equal to than 10%
# i.e.: how often each feature had pvalue lower or equal to 10%
np.apply_along_axis(lambda x: x in x<=0.1, 0, pvalues).mean(0)
[22]:
array([0.1 , 0.7 , 0.63, 0.05])
[23]:
# How often each feature had the lowest pvalue
np.apply_along_axis(lambda x: x in x==0, 1, np.argsort(pvalues)).mean(0)
[23]:
array([0.02, 0.19, 0.45, 0.34])